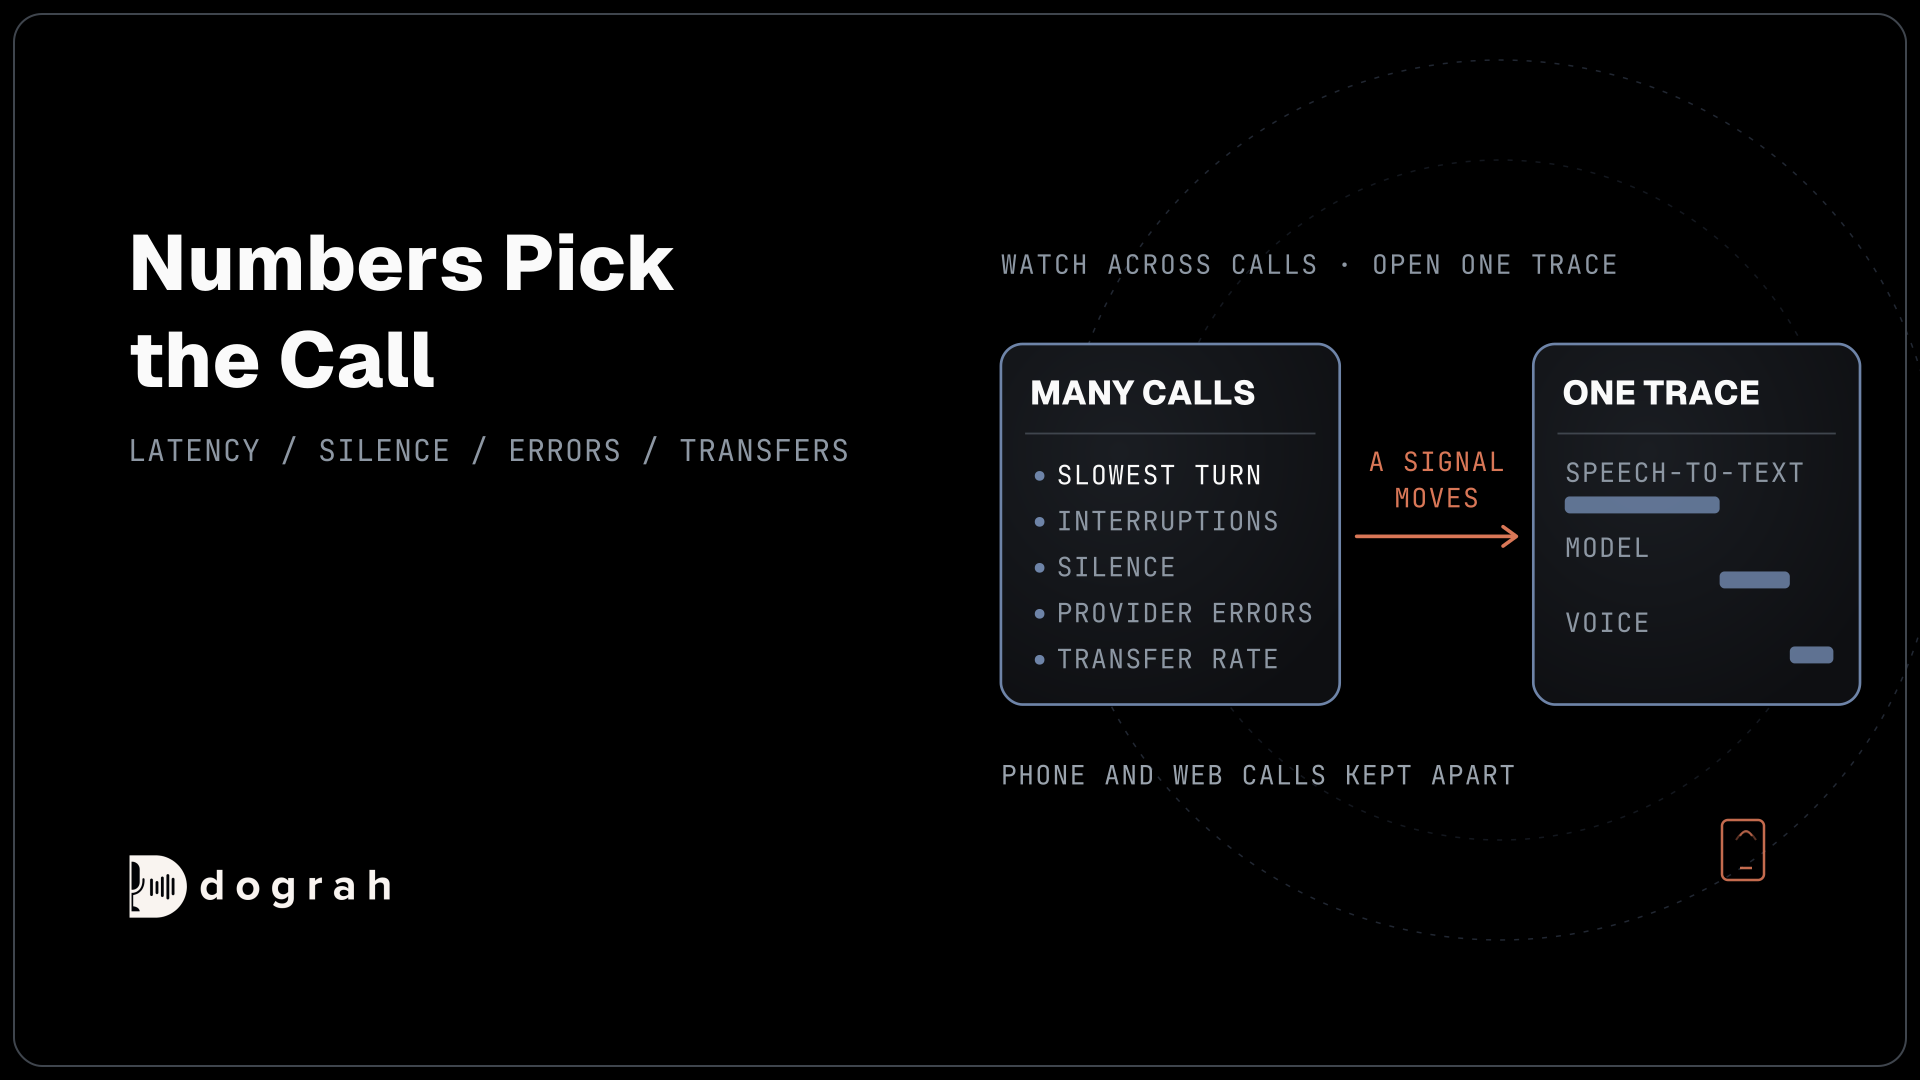

Observability for voice AI means watching latency per layer as the median and slowest turn, interruptions, silence after the caller speaks, provider errors and changes in the transfer rate, because across many calls these predict a bad one. When one of them moves, open the traces of the calls behind it to find the cause.
Key Takeaways
- A trace explains one call. Numbers across calls tell you which trace to open.
- Watch the median and slowest turn for each layer, never the average alone.
- Keep phone calls apart from web calls, because the same agent measures differently.
A trace shows why one call failed, but not which of thousands to open. We cover what to watch across calls, from latency per layer and interruptions to provider errors and transfers, why phone and web calls stay apart and where Dograh sends the numbers. It is part of our guide to measuring voice-agent quality.
One trace explains a call, numbers pick the call
A trace tells you why one call went wrong. Observability tells you which calls to look at. You need both, and in that order.
A voice agent's trace breaks each turn into its parts: what speech-to-text heard, what the model got and answered, and how long the voice took to start. Dograh runs on a fork of Pipecat, so each turn is split this way. That works well for one call and badly for a thousand, because nobody opens a thousand traces.
The numbers across calls matter because single calls mislead. In research from Thinking Machines Lab, 1,000 runs of the same prompt at temperature 0 produced 80 different completions. The same agent will have good and bad calls on the same day. What predicts trouble is a signal that moves across many calls, such as the slowest turn getting slower all week.
Latency per layer, read as percentiles
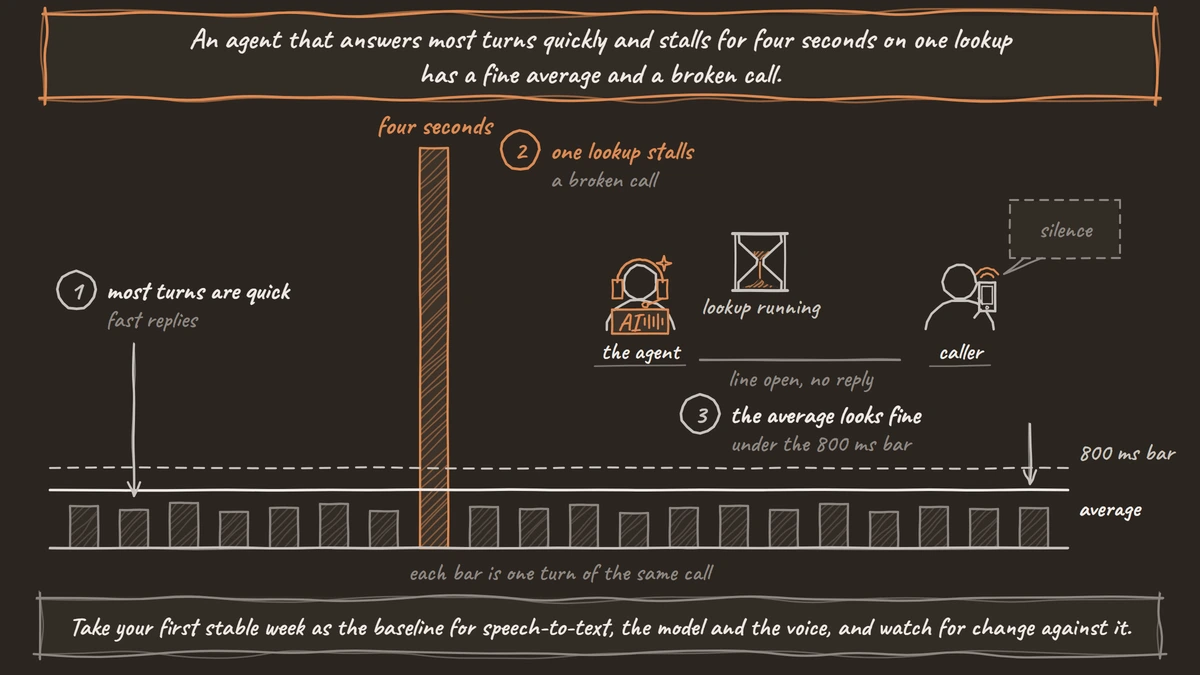
Turn latency is the first signal to watch, split by layer. The bar for a natural conversation is under 800 ms from the caller finishing to the agent starting to speak. Of the three layers, speech-to-text turns out to be the slow one more often than the language model does.
Read it as the median turn and the slowest turn, never as an average. An agent that answers most turns quickly and stalls for four seconds on one lookup has a fine average and a broken call. We don't set a fixed target for each layer. Take your first stable week as the baseline for speech-to-text, the model and the voice, and watch for change against it.
Dograh gives you this at two levels. For one call, View Trace opens the run in Langfuse tracing with the speech-to-text, model and voice time for each turn. For many calls, the call events export writes a latency breakdown row for every turn, with each layer's time to first byte, and a summary row per call with its median and slowest turn.
The QA reviewer also receives each call's average and longest latency and the model's average time to first byte. One trap: the Call Transcript's Reasoning Delay times only part of a turn, so it is not a number to hold against the 800 ms bar. Our post on how to read call traces shows how to find the slow layer once you have the call.

Open Source Alternative to Vapi / Retell
Self-hosted voice agent platform — no per-minute fees
dograh-hq/dograh
Star on GitHub
Interruptions, silence and repeats
How turns hand over between caller and agent is a quality signal of its own. Full-Duplex-Bench, an academic benchmark, measures pause handling, backchanneling, turn-taking and interruption management as separate dimensions, apart from speed.
Interruptions first. A step with Allow Interruption turned on lets the caller cut in, and the call events export records each interruption. The setting is off by default for each step, and then the caller's speech is ignored until the agent finishes, so a low interruption count on that step tells you nothing. A rising count on a step that allows it usually means the agent's turns run too long. Turn Detection in the agent's Settings decides when a caller has finished, Transcription-based or Smart Turn Analyzer. Our post on barge-in, endpointing and turn-taking explains the trade-off.
Silence next. The export writes a warning when the agent stays silent after the caller finishes a turn, with the step name and any tool call still running. That is usually a slow lookup or a stuck step. Other platforms flag slow starts the same way: Twilio's Conversation Relay Insights dashboard counts calls where the agent took longer than 1.2 seconds to start responding. The DEAD_AIR tag from QA catches silence the reviewer can read in the transcript.
Repeats last. AssemblyAI calls caller repeat rate "the closest thing to a free accuracy signal on live traffic". In Dograh, repeats show up through the QA tags HEARING_ISSUES and USER_NOT_UNDERSTANDING, and ASSISTANT_IN_LOOP marks the agent repeating itself.
Errors and transfers as early warnings
Errors from speech, model and voice providers show up before callers complain. The call events export records pipeline errors, empty replies from the model and tool calls that never return, each with the step it happened in.
Campaigns act on errors for you. The circuit breaker is on by default for a new campaign and pauses it when half the calls in a 120-second window fail, once at least five calls have finished. A 401, 402 or 403 from any provider pauses the campaign at once, as the campaigns overview explains. If you use your own LLM keys, a backup LLM can take over when the main one errors or stays silent for 1.5 seconds. It is off by default, so turn it on.
The transfer rate is the other early warning. A sudden rise usually means a new kind of caller, a broken tool or a prompt change that made the agent give up sooner. Filter Agent Runs by your transfer's disposition code to see the calls, and read a few. The voice agent analytics guide covers the Reports card that counts transfers and how to make it count yours.
Join the Dograh Community
Dograh is an OSS alternative to Vapi. Join our Slack community for queries, releases, best practices & community interactions.
Keep phone calls and web calls apart
The same agent measures differently on a phone line and in a browser, so never mix the two in one number. Most calls that come in over a phone line carry 8 kHz audio, while a browser test sends 16 kHz.
The gap shows in speech recognition. In a Caller Digital benchmark of 900 utterances in five Indian languages, word error rate rose from 6.1% on wideband audio to 11.8% over G.711 phone audio. How much your agent loses depends on the speech model and the phone path, so measure it on your own calls.
In Agent Runs, the Type filter splits Telephony, Web call and Text chat. Keep your team's browser tests out of the phone numbers, or they will flatter every chart.
Where the numbers land, and the alerts
For trends across many calls, the numbers need to land in a table you can query. Set up the call events export under Platform Settings, in Call events. It writes one row per event to a BigQuery table you own, with the time, event name, run, turn, a value in milliseconds and the step name.
Events are sent after each call ends. They cover speech, accepted user turns, tool calls, silence warnings, stage latencies, pipeline errors and a final summary for the call. No transcript text or audio goes into the rows. If you prefer a ready-made view, the Noveum integration exports each finished call as per-turn spans with latency breakdowns and interruptions, with no delay added to the live call.
Alerts come from the tool your events land in. Pick a few signals, such as the slowest turn on phone calls or silence warnings per hundred calls, and alert on a change that lasts, not a single spike. When one fires, open the runs behind it and read their traces.
Glossary
- Latency breakdown
- One turn's timing split by layer: speech-to-text, the language model and the voice, each as time to first byte. It shows which layer made a slow turn slow.
- Slowest turn (tail latency)
- The worst turn in a call, or the slow end of turns across calls. A caller remembers the four-second pause, so track it beside the median.
- Barge-in
- A caller speaking over the agent and cutting it off. In Dograh it only works on steps with Allow Interruption turned on, which is off by default.
- Call events export
- Dograh's per-call diagnostics sent to your own BigQuery table after each call: one row per event, such as a turn's latency breakdown, an interruption or a silence warning.