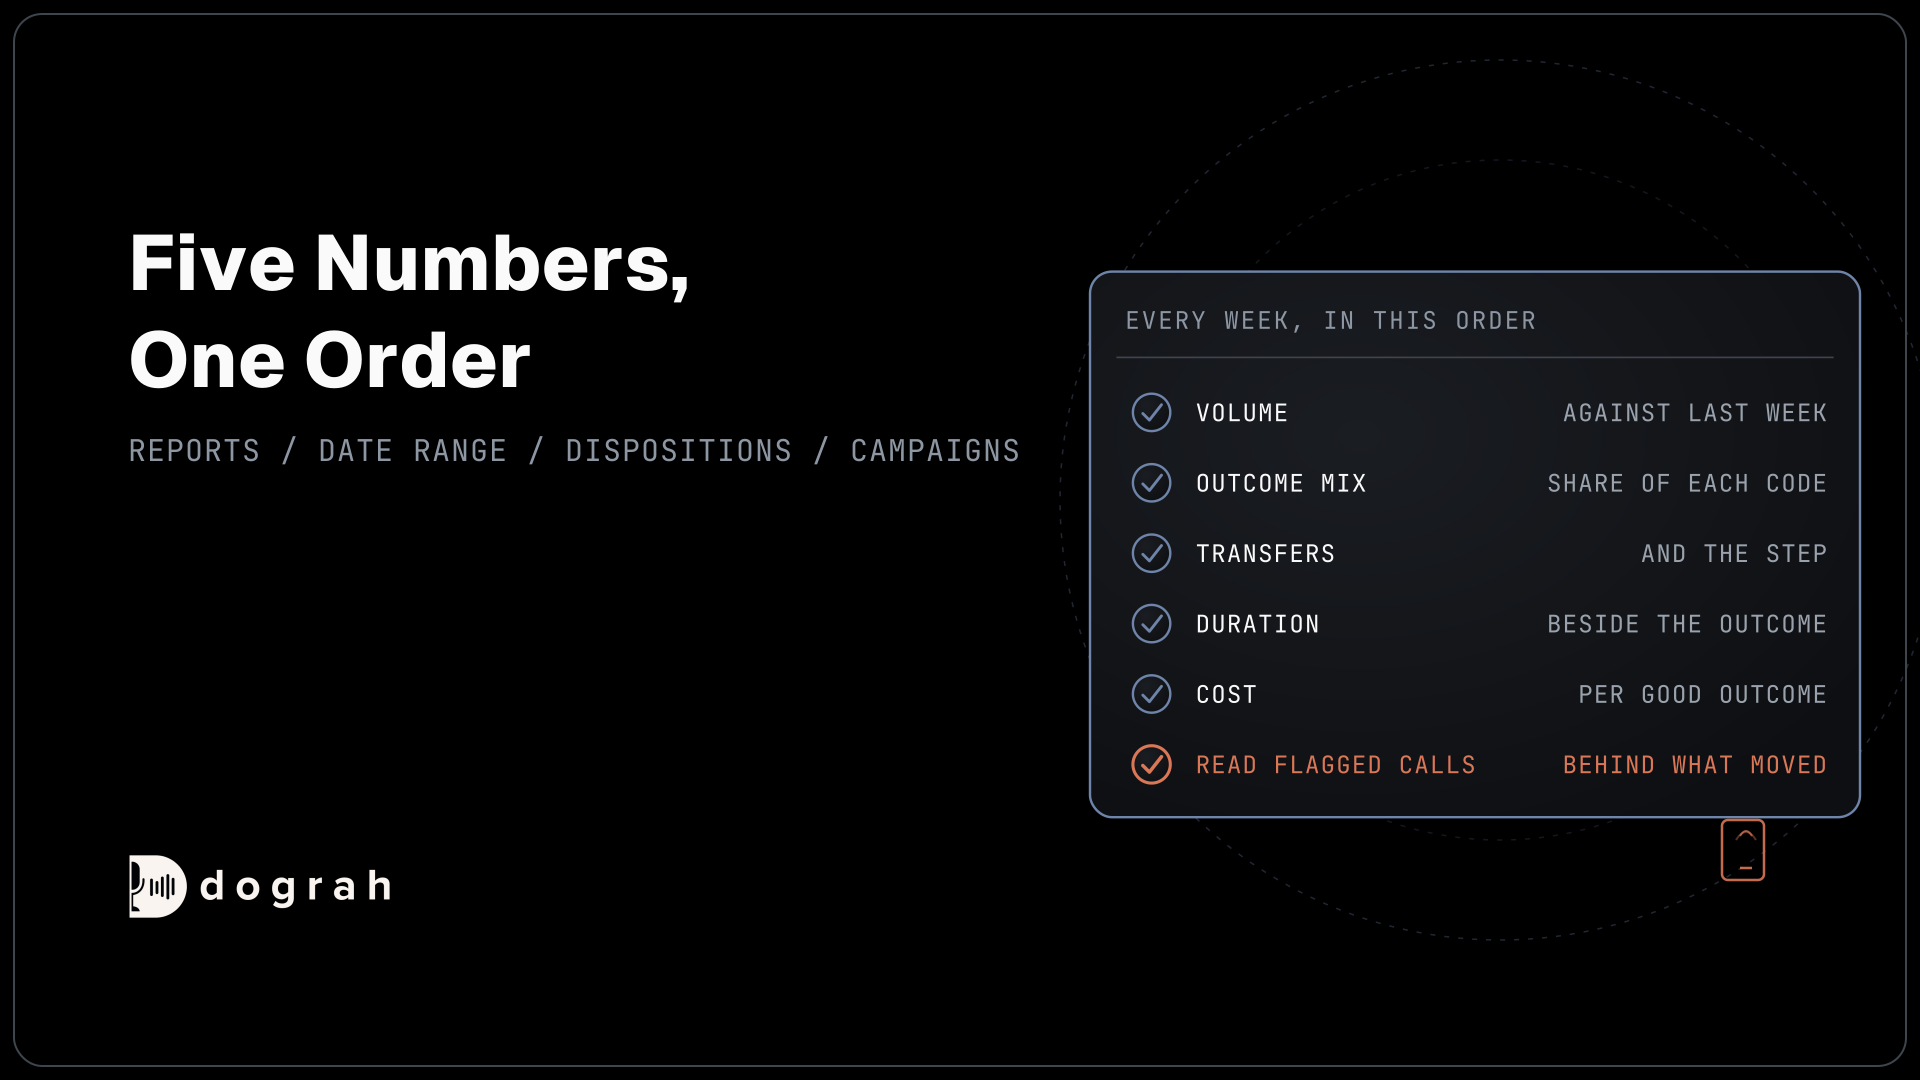

Voice agent analytics works best as a weekly review of five numbers. Track call volume, the mix of outcome codes, transfers, call duration read beside the outcome, and cost, comparing each with last week. Then read a sample of calls flagged by QA, starting with the calls behind whichever number moved.
Key Takeaways
- Review the same five numbers every week, in the same order.
- Never read call duration without the outcome code beside it.
- Weekly numbers come from date-range exports, since Reports shows one day.
Call data piles up fast, and without a fixed habit nobody notices outcomes slipping. We set out a weekly review in Dograh, covering where the numbers come from, the five to read in order, which flagged calls to open and how campaigns fit in. It is part of our guide to measuring voice-agent quality.
Why a weekly review beats a dashboard
A dashboard nobody opens on a schedule changes nothing. A short review at the same time every week, with the same numbers in the same order, turns call data into decisions.
The pressure to show results is real. In Gartner's survey of 199 service and support leaders, AI spending rose 38% while overall service budgets grew 2%. Gartner's Kim Hedlin put the challenge as "ensuring those investments produce measurable business value."
A week is the right span for most teams. Daily numbers swing with the day of the week and one odd campaign. A month is too slow to catch a broken prompt. If you need the business case for the agent itself, our guide to voice agent ROI covers it, and this post covers the routine that keeps it honest.
Where the numbers come from
Dograh has three places for the numbers, and each fits a different question.
Reports, under Manage in the sidebar, shows one day at a time in your organization's time zone. You can view all agents or one. It has a Total Workflow Runs card, a Transfer Dispositions card, a Disposition Distribution chart with the top five codes, and a Call Duration Distribution chart. Download CSV gives that day's calls with phone number, disposition, duration and a link to each run.
For a week, export with a date range. In the agent's Settings, choose Report and click Download Report with the week's dates. A campaign page has its own Download Report with a date filter, and Agent Runs has Download Filtered Results for any filtered list. Each run CSV row carries the disposition, duration in seconds, extracted variables, call tags and links to the transcript and recording.
If your team already works in BigQuery, the call events export adds per-call timing and a summary row for every call to your own table.

Open Source Alternative to Vapi / Retell
Self-hosted voice agent platform — no per-minute fees
dograh-hq/dograh
Star on GitHub
The five numbers, in order
Read them in this order, because each one explains the next.
1. Volume
Count the calls this week against last week, split by agent and by inbound or outbound. A drop in outbound volume usually means a campaign paused, ran out of contacts or hit its calling hours. A drop in inbound usually comes from outside, such as a changed phone number or a marketing pause.
2. Outcome mix
The share of each outcome code is the center of the review. It needs call dispositions turned on, so every call ends with one code from your list. Turn on Disposition mapping in Platform Settings if you want your own code names in reports and filters. Watch for a code whose share moves by more than its usual swing, and for a growing UNKNOWN, which means calls ended without a code.
3. Transfers
The Transfer Dispositions card counts only calls whose mapped code is XFER, the code dialers such as VICIdial use for transfers. To make it count yours, turn on Disposition mapping and map your transfer outcome to XFER. Otherwise, filter Agent Runs by your transfer code. A transfer is often the right outcome, so watch the rate and the step each transfer came from.
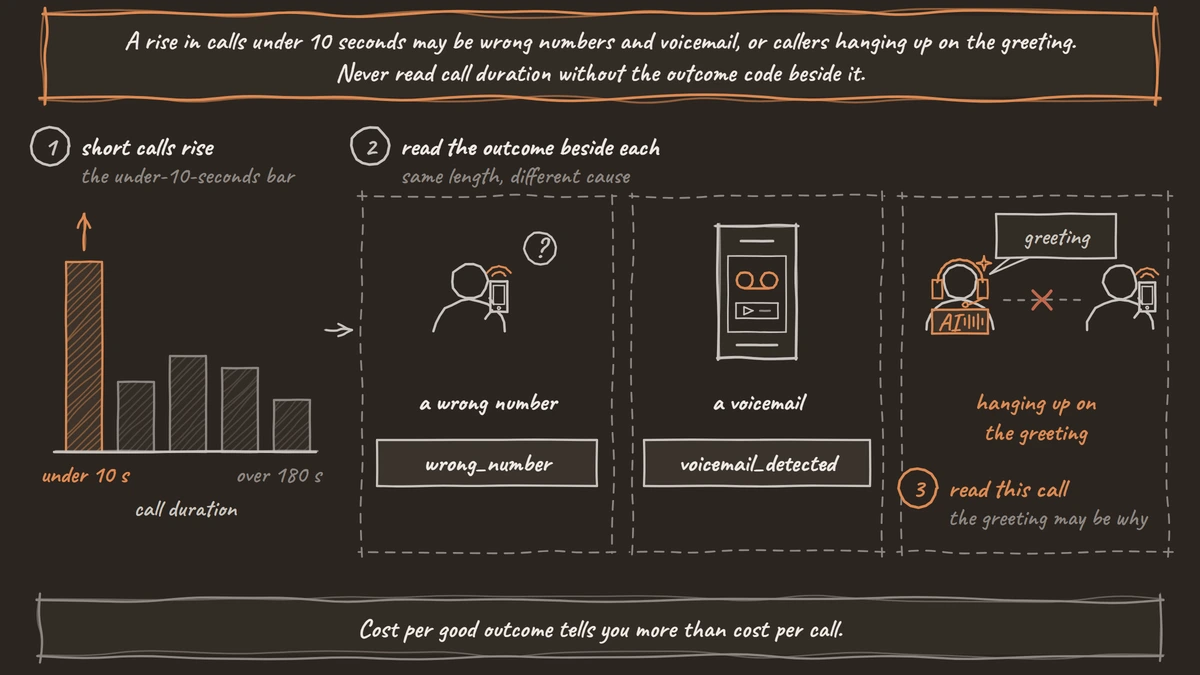
4. Duration, read beside the outcome
Duration alone misleads. An agent can look efficient by ending calls sooner while callers leave without what they called for. Read the Call Duration Distribution, from under 10 seconds to over 180, next to the outcome codes. A rise in calls under 10 seconds may be wrong numbers and voicemail, or callers hanging up on the greeting. Other platforms use the same lens. Twilio's Conversation Relay Insights groups calls into similar time buckets and shows who hung up.
5. Cost
Agent Runs shows a Cost (USD) column for each call once pricing is set for your organization, and the Billing page shows totals. Divide the week's cost by the calls that reached a good outcome, such as qualified or booked. Cost per good outcome tells you more than cost per call.
Read a sample of flagged calls
Numbers tell you where to look. The calls tell you why. After the five numbers, read a few calls behind whichever number moved most.
QA reviews each call by step and shows its tags under QA Results on the run page. To count tags across the week, send them to your own system with a Webhook node payload after each call. Start with calls tagged USER_FRUSTRATED or ASSISTANT_REPLY_IMPROPER on the outcome that moved, and read three to five of them end to end.
Write down one line per finding with the run link. Our post on post-call analysis covers turning those findings into script and product changes.
Join the Dograh Community
Dograh is an OSS alternative to Vapi. Join our Slack community for queries, releases, best practices & community interactions.
Campaigns and agent versions
Outbound teams should give each campaign its own short review. The campaign page shows progress through the list and an activity log, and its report export filters by date. Read the outcome mix per campaign, since one list of stale numbers can drag the whole week down. The campaigns overview covers retries and calling hours, the two settings most often behind a volume change.
If you are testing two versions of an agent, the campaign's traffic split shows the target and actual share for each version, the completed attempts and the outcomes. Compare the outcome mix between versions as well as completion. Our guide to A/B testing voice agent scripts covers how long to run a split and how to read it.
Taking the numbers into a BI tool
Teams that want charts across months can load the weekly CSV into a spreadsheet or BI tool. Keep one file per week and stack them, so trends build up without extra work.
The run ID joins the files. A run CSV row and the call events rows for the same call share it, so you can put outcome codes next to turn timing for the same calls. Build a chart only once you have read the same number by hand for a few weeks and know what a normal swing looks like.
Glossary
- Disposition mix
- The share of calls ending in each outcome code over a period. A shift in the mix week on week is the clearest early sign that callers or the agent changed.
- XFER
- The transfer code used by dialers such as VICIdial. Dograh's Reports transfer card counts only calls mapped to XFER, so map your transfer outcome to it.
- Duration bucket
- A range of call lengths, such as under 10 seconds or over 180, used to show how call length is spread. Read buckets beside outcome codes, never alone.
- Run CSV
- Dograh's export with one row per call: disposition, duration, extracted variables, call tags, and transcript and recording links, filterable by date range.